
Digital Twin
A virtual counterpart of each tool, chamber and line, synchronized with real state and ready for scenario simulation.
AI × ADVANCED MANUFACTURING
Verifiable frontier architectures, benchmarked and deployed on the tool floor.
POSITIONING
The value of AI in semiconductor manufacturing comes from turning sensor, metrology and inspection data into decisions you can act on.
BETTER treats published industry and academic architectures as benchmarks, then selects the method that suits each process scenario.
The architectures and quantitative results listed below come from third-party research, used as technical reference benchmarks and not measurements of our own.

THREE PILLARS
Every process area shares the same methodological backbone.
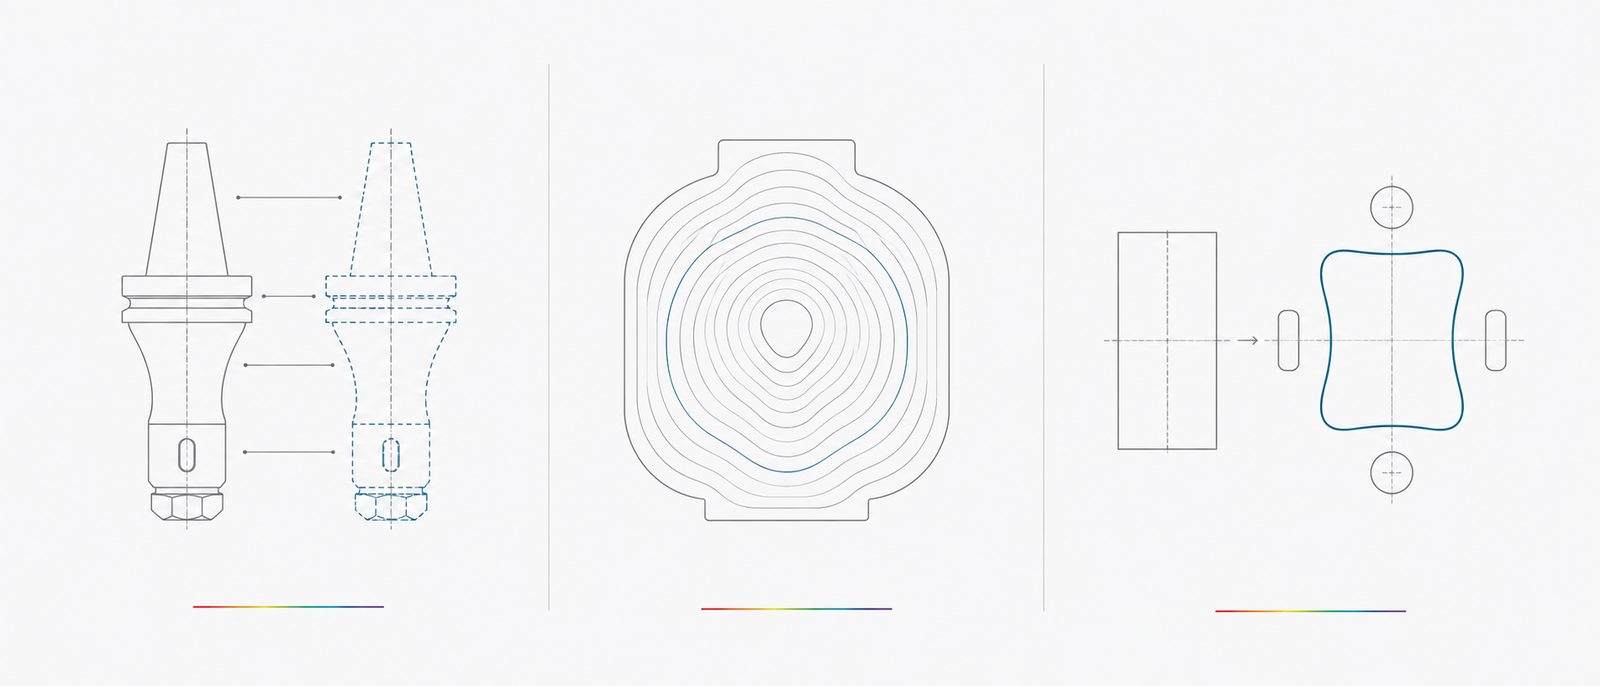
A virtual counterpart of each tool, chamber and line, synchronized with real state and ready for scenario simulation.
Plasma, heat transfer, fluid and ion transport models predict how the process will behave.
Generative methods and inverse lithography correction address patterning and optical proximity effects.
BENCHMARK ARCHITECTURES
Everything below is third-party published research, used as deployment benchmarks.
| Domain | Model (year) | Core architecture | Input features | Output / metrics | Key quantitative results |
|---|---|---|---|---|---|
| Wafer map defect classification | G2LGAN + CNN (2025) | Two-stage GAN augmentation + MobileNetV2 | Wafer map images (class-imbalanced data) | Accuracy / F1 / 1-NN (generation quality) | Acc 98.39%, F1 93.01% |
| Wafer map defect classification | CNN-ESN (2026) | ResNet34 + echo state network | Noisy wafer maps | Acc (robustness at σ=0.1 noise) | Clean 94.74%, noisy 87.30% |
| SEM defect classification | IBM ASMC (2025) | ViT (DINOv2) + semi-supervised | SEM images (<15 per class) | Classification accuracy | >90% (few-shot) |
| Yield prediction | PDF Exensio (2025) | XGBoost + PCA | In-line defect, metrology, electrical test, FDC | Die/wafer pass-fail, precision/recall | Tunable threshold balances overkill/underkill |
| Yield root cause | TSMC smart manufacturing | RNN (time-series FDC) + federated learning | Tool sensor time series, inspection data | Yield-impacting defect prediction accuracy | ~92% (28–3nm), escape rate -15% |
| Thermal simulation surrogate | DeepOHeat-v1 (2025) | DeepONet + KAN + GMRES refinement | Power map / floorplan (physics-informed training, no simulation data) | MAPE, training time, memory | MAPE 0.035%, training -62×, memory -31× |
| Joint thermal-IR | ThermEDGe/IREDGe | Encoder-Decoder CNN | Time-varying power maps, PDN density | IR error (mV), temperature contour | Average IR error 0.053mV |
| 2.5D electrothermal co-design | TTSV-HMO (2025) | Equivalent model + hybrid metaheuristic (PSO+SA) | TTSV pitch, chiplet placement, power density | Temperature/impedance MAE, fitness | Temperature MAE 0.35%, impedance 3.97% |
| Static IR drop | MaxViT/U-Net (2026) | MaxViT encoder + U-Net/FPN decoder | Resistance, current and power pad maps (SPICE rendered to images) | MAE, F1 (>90% peak hotspots), inference time | MAE < 15×10⁻⁵V, 10–30× faster than NGSPICE |
| Static IR drop | ICCAD'23 winning flow | ConvNeXtV2-Nano + UPerNet | Per-layer resistance maps + effective distance maps | MAE (mV), F1 | MAE 0.075mV, F1 0.56 |
| Dynamic IR drop | PDNNet (2024) | Heterogeneous GNN (PDNGraph) + CNN | PDN structure graph + dynamic current maps | NMAE, speedup | NMAE improved 39.3%, 545× speedup |
| Dynamic IR drop | Dual-path spatiotemporal model (DATE'25) | 3D SW-MSA Transformer | Time-window decomposed power maps (internal/switching/leakage/toggle rate) | Hotspot prediction accuracy | Outperforms 2D/3D-CNN and recurrent U-Net |
| Electromigration | Dey et al. (2020) | 10-layer NN regression + logistic classifier | J, L, T, IR drop, MTTF labels (KLU + Black) | R², AMSE, failed-segment detection | Large speedup, MTTF comparable to exact models |
| Electromigration | BPINN-EM-Post (2025) | Bayesian PINN | Korhonen PDE physics residual + observations | Uncertainty quantification, lifetime distribution | Overcomes PINN overfitting, supports multi-segment lines |
| ATPG | InF-ATPG (2025) | FFR partitioning + QGNN + DQN | Logic state, SCOAP controllability/observability | Backtracks, fault coverage, UFP | Backtracks -55.06%, UFP 0.50% |
| ATPG (commercial) | Synopsys TSO.ai | AI setup tuning (black-box optimization) | Design characteristics, ATPG engine behavior, constraints | Pattern count, coverage, convergence iterations | Patterns -20–25% (over 50% in some cases) |
| BIST enhancement | LITE (2025) | Standard-cell scan enhancement + SCOAP analysis | Netlist hypergraph, CC0/CC1/CObs | Pattern count, random pattern coverage | ATPG patterns -31%, improved RPR coverage |
| KGD/outlier detection | GPR/RevTransC/conformal prediction | GPR spatial modeling, unsupervised transform, conformal QR + CatBoost | Wafer-level parametric test data, WAT | AUROC, DPPM, Vmin interval coverage | Outperforms DPAT; Vmin ~90% coverage guarantee |
| Test time | GPU real-time adaptive test | GPU-accelerated ML (production deployment) | Real-time test data stream | Test time, defect coverage maintained | Blackwell production: -25% test time |
| Layout hotspot | Explainable GAT (ASP-DAC'26) | Graph attention network (8 heads) | Layout graph (5-dim node features, adjacency matrix) | Recall, false alarm rate, explainability | 5–12× less memory than image-based methods |
| e-Beam review | SEMVision H20 (2025) | Deep learning image classification (in-fab retraining) | CFE e-beam images | Review speed, real vs. nuisance defect discrimination | 3× speed, deployed at 2nm/GAA customers |
Sources are research and industry information published by third parties. BETTER uses them as the benchmark for the work it deploys, not measurements of our own.
PROCESS × AI
The main deployment direction for each of the nine areas.
| Process area | Main benchmark architectures | Deployment focus |
|---|---|---|
| Photolithography | LithoDreamer / ILT, explainable GAT (ASP-DAC'26) | Generative mask correction, layout hotspot prediction, track digital twin |
| Dry & Plasma Etch | Plasma physics simulation, TSMC RNN time-series FDC + federated learning | Etch rate prediction, anomaly detection, endpoint determination |
| CVD | DeepOHeat-v1 (2025), ThermEDGe/IREDGe | Thermal field surrogate, thickness uniformity, chamber digital twin |
| Bake & Thermal | DeepOHeat-v1 (2025), ThermEDGe/IREDGe | Temperature contour prediction, thermal budget optimization, batch digital twin |
| Ion Implant | Monte Carlo physics simulation, BPINN-EM-Post (2025), GPR | Dopant profile simulation, uncertainty quantification, spatial outlier detection |
| CMP | Polish physics simulation, PDF Exensio (2025), RNN time-series FDC | Removal rate uniformity, yield prediction, consumable life trends |
| Wafer Clean & Dry | IBM ASMC (2025) ViT, RNN time-series FDC | Few-shot SEM defect classification, chemistry anomaly detection, particle root cause |
| Inspection & Test | G2LGAN + CNN, CNN-ESN, SEMVision H20, GPU adaptive test, KGD conformal prediction, InF-ATPG | Wafer map classification, e-beam review, test time optimization, outlier detection |
| Photomask | LithoDreamer / ILT, MaxViT/U-Net, explainable GAT | Pattern correction, risk area localization, writing digital twin |
HOW WE DELIVER
From scope definition to team handover, with verifiable metrics.
01
Consultation
Define the problem scenario and quantifiable targets, then assess data availability and the value of deployment.
02
Data integration
Consolidate tool sensor, process metrology and inspection data into one consistent data format.
03
Model deployment
Select and tune the benchmark architecture that fits the scenario, then build the training and inference flow.
04
Validation
Compare against the baseline on agreed metrics and confirm stability and repeatability.
05
Training
Hand over operating and interpretation methods so your team can run and maintain the system.

GET IN TOUCH
One point of contact from equipment selection through installation and AI integration.